Active Learning Statistics: Evidence and Limits
A sourced reference to active learning, retrieval practice and study methods, with a downloadable chart, research context and limits for each finding.
By Code Nexus team · 6 min read · Published · Updated · Reviewed by Code Nexus team
Active learning research gives educators useful evidence for choosing how students participate. This reference gathers selected findings, explains their measures and supplies an original chart for reuse. It accompanies our guide to learning by doing.
Evidence checked: 8 October 2026. The study years remain visible below. Checking an older paper today does not make its findings a new study. These are published research results, not Code Nexus learner outcomes.
What are the key active learning statistics?
Freeman and colleagues' 2014 meta-analysis covered 225 studies of undergraduate STEM courses. Here are its reported results, with the relevant study subset shown for each measure.
| Measure | Reported result | Evidence subset | Source |
|---|---|---|---|
| Average course failure rate | Traditional lecture: 33.8%; active learning: 21.8% | 67 studies | Freeman et al., Results and Figure 1B |
| Exam and concept-inventory performance | 0.47 standard deviations higher under active learning | 158 studies | Freeman et al., Results |
The interventions varied. Course failure usually meant a D or F grade or withdrawal. These classroom results do not establish an effect for a particular coding platform or certification exam.
How do failure rates compare?
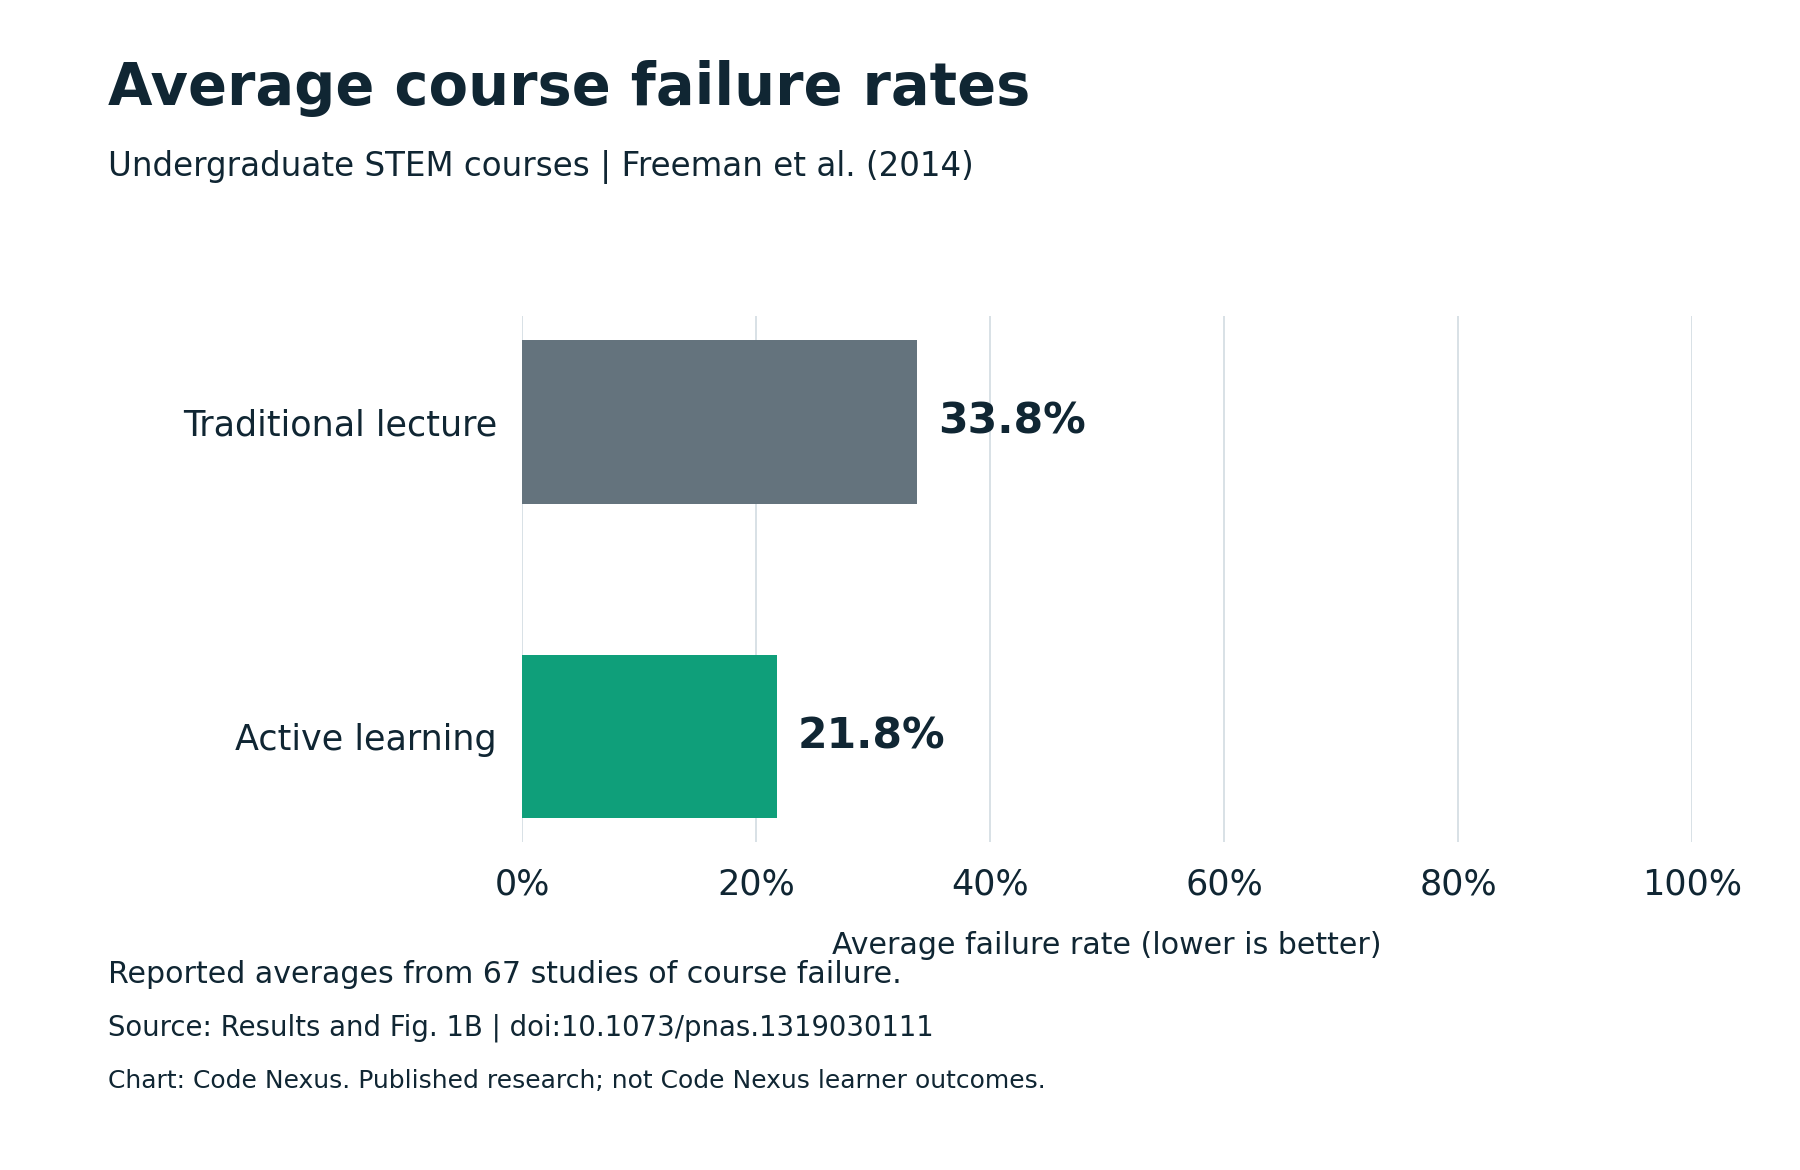
Chart: Code Nexus. Data: Freeman et al. (2014), Results and Figure 1B. The scale starts at zero and ends at 100%. These are reported average rates, not participant-level data.
Download the chart as PNG · Download the chart as SVG
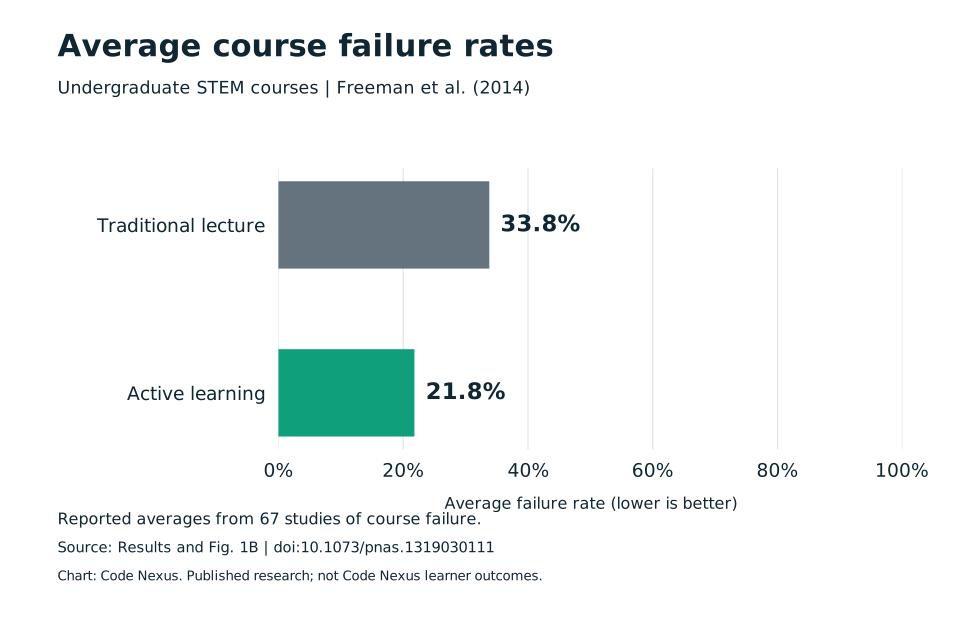
When writing about a difference between percentages, name the unit. Subtracting 21.8 from 33.8 gives 12 percentage points. Dividing that difference by 33.8 gives approximately 35.5% lower, using the lecture average as the reference. These are calculations from rounded summary values, not new experimental estimates.
A percentage-point difference and a relative percentage difference answer different questions. Always state the comparison group. Do not turn either calculation into a predicted result for an individual learner.
What does an improvement of 0.47 standard deviations mean?
A standardized mean difference expresses a difference relative to the variability of scores. It lets researchers compare outcomes measured on different scales.
0.47 standard deviations is not a 47% improvement, a gain of 47 marks or a 47-percentage-point increase in pass rates. To make a statement in marks, you would need an appropriate score scale and information about its variability. Keep the reported unit when citing the result.
The general rule for a research reference is to preserve the measure that was actually analysed. Course failure, exam scores, recall and satisfaction should have separate labels. Combining them into one headline about how much better a method is can hide what was tested.
Does retrieval practice improve long-term retention?
Retrieval practice means attempting to recall material rather than looking at it again. In two experiments using prose passages, Roediger and Karpicke (2006) compared recall tests without feedback with restudying. Restudying did better on a test after five minutes; prior testing did better after a delay.
Scope: this summary is verified against the publisher's abstract. We reproduce no numerical retention percentage. Remembering a passage is a different outcome from debugging a program.
A possible programming application is to close a worked example, explain its logic from memory and then attempt a similar task. That is an application of the idea, not a result measured in this experiment. See learning Python by building for practical tasks.
Which study techniques have stronger evidence?
Dunlosky and colleagues (2013), Table 4, assigned qualitative utility ratings to ten techniques.
| Rating in the 2013 review | Techniques |
|---|---|
| High | Practice testing; distributed practice |
| Moderate | Elaborative interrogation; self-explanation; interleaved practice |
| Low | Summarization; highlighting; keyword mnemonic; imagery use for text learning; rereading |
The ratings reflect the review's assessment of effectiveness and generalisability. They are not percentage gains or a current league table of every teaching method. A low rating does not mean a technique is useless for every purpose.
Distributed practice spreads study across sessions. Self-explanation involves explaining reasoning. Interleaving mixes types of problem. When choosing a technique, check whether its evidence concerns the material, learners and outcome you care about.
Can learning feel less effective while producing better results?
Yes, in a particular controlled classroom comparison. Deslauriers and colleagues (2019) compared active and passive instruction in introductory college physics. Students learned more in the active condition but reported a lower feeling of learning. The groups received the same content.
This finding separates perceived learning from measured learning in that setting. It does not establish that frustration, confusion or difficulty always helps. A broken interface or unclear instruction can also make a task difficult.
For an educator, the useful response is to examine both experience and performance. If learners dislike a task, inspect the instruction, feedback and accessibility alongside evidence of what they can do. Do not dismiss their experience because a study found a perception gap.
Do beginners still need explanations and worked examples?
Active participation can include substantial guidance. Kirschner, Sweller and Clark (2006) argue that novices particularly benefit from instructional guidance, with its advantage diminishing as prior knowledge increases. Their paper is an analysis and review, rather than one numerical experiment.
An explanation followed by an attempt, feedback and a revised attempt combines guidance with activity. Leaving a beginner with an unexplained problem is a different design. Our theory-versus-practice article examines that distinction in more detail.
How was this reference assembled?
This is a selected evidence reference, not a systematic review, a new meta-analysis or an exhaustive account of the latest literature. We chose five publications relevant to active participation, recall, study techniques, perceived learning and guidance. This selection supports specific questions rather than an estimate across all research.
For the numerical table and chart, we checked Freeman's original Results section and Figure 1B. The downloadable evidence file identifies the source location and unit. The retrieval summary uses the publisher's abstract; the other summaries use the linked papers. No participant records were collected or reconstructed.
The original chart was drawn from the reported summary values. It does not reproduce a publisher's figure. The JSON file contains selected summary values, qualitative findings and source metadata, rather than the underlying study datasets.
Keep three boundaries in mind when using this page:
- Population: classroom and laboratory evidence may not transfer directly to adults studying independently.
- Outcome: recall, course performance and engineering competence require different measures.
- Product: using a research-informed teaching choice does not establish a platform's effectiveness.
Code Nexus has not conducted a learner-outcome study. Nothing on this page establishes its completion rates, external certification pass rates or employment outcomes. Read how we teach for our design choices, and the public curriculum for episode overviews.
Download the evidence and cite this page
- Download the evidence file (JSON): reported values, units, source locations, findings and limitations.
- Download the chart (PNG): suitable for documents and articles.
- Download the chart (SVG): a vector version for resizing.
Suggested page citation: Code Nexus team. (2026). Active Learning Statistics: Evidence and Limits. https://www.codenexus.co.za/blog/active-learning-statistics. Evidence checked 8 October 2026. Add your access date when citing it.
Suggested chart credit: Chart: Code Nexus. Data: Freeman et al. (2014), doi:10.1073/pnas.1319030111. Link to this reference page and the original paper.
You may reuse our original chart with attribution. This permission covers the Code Nexus chart design; it does not grant rights to the source papers or their figures. When a claim comes from a research paper, cite that paper directly alongside this reference. Preserve the population and outcome labels when reusing the visual.
For a broader introduction, continue with learning by doing. For a practical learning path, explore the Code Nexus curriculum.
Follow Code Nexus
Frequently asked questions
- Does active learning improve student performance?
- Freeman et al. (2014) found higher exam and concept-inventory performance under active learning in undergraduate STEM courses. This is evidence about those educational settings, not a measured improvement for Code Nexus learners.
- Is 0.47 standard deviations the same as a 47% improvement?
- No. A standardized mean difference expresses the difference between groups relative to score variability. It is not a percentage increase or a percentage-point gain.
- Does active learning mean beginners should learn without guidance?
- No. Learners can attempt tasks while receiving explanations, worked examples and feedback. Active participation and instructional guidance can be combined.
- Are these statistics from Code Nexus learners?
- No. This page summarises selected published research. Code Nexus has not conducted a learner-outcome study, and these findings do not establish its completion, certification pass or employment rates.
Related articles
- Learn by Doing: Why Practice Beats Passive Study
What the research on active learning and retrieval practice says about learning by doing, where the evidence stops, and how to study practically.
- Tutorial Hell: How to Get Out of It
Tutorial hell explained: why following tutorials feels like progress but leaves you stuck, what research on learning says, and a practical way out.
- Theory vs Practical Learning: What Research Says
Theory or practice first? What research on active learning, guided instruction and the feeling of learning says about the right balance for beginners.
Mentioned in
- Learn by Doing: Why Practice Beats Passive Study
What the research on active learning and retrieval practice says about learning by doing, where the evidence stops, and how to study practically.
Sources
- Freeman et al. (2014). Active learning increases student performance in science, engineering, and mathematics. PNAS 111(23), 8410–8415. (accessed 2026-10-08)
- Roediger and Karpicke (2006). Test-enhanced learning: Taking memory tests improves long-term retention. Psychological Science 17(3), 249–255. (accessed 2026-10-08)
- Dunlosky et al. (2013). Improving students' learning with effective learning techniques. Psychological Science in the Public Interest 14(1), 4–58. (accessed 2026-10-08)
- Deslauriers et al. (2019). Measuring actual learning versus feeling of learning in response to being actively engaged in the classroom. PNAS 116(39), 19251–19257. (accessed 2026-10-08)
- Kirschner, Sweller and Clark (2006). Why minimal guidance during instruction does not work. Educational Psychologist 41(2), 75–86. (accessed 2026-10-08)